Dashboard & Overview
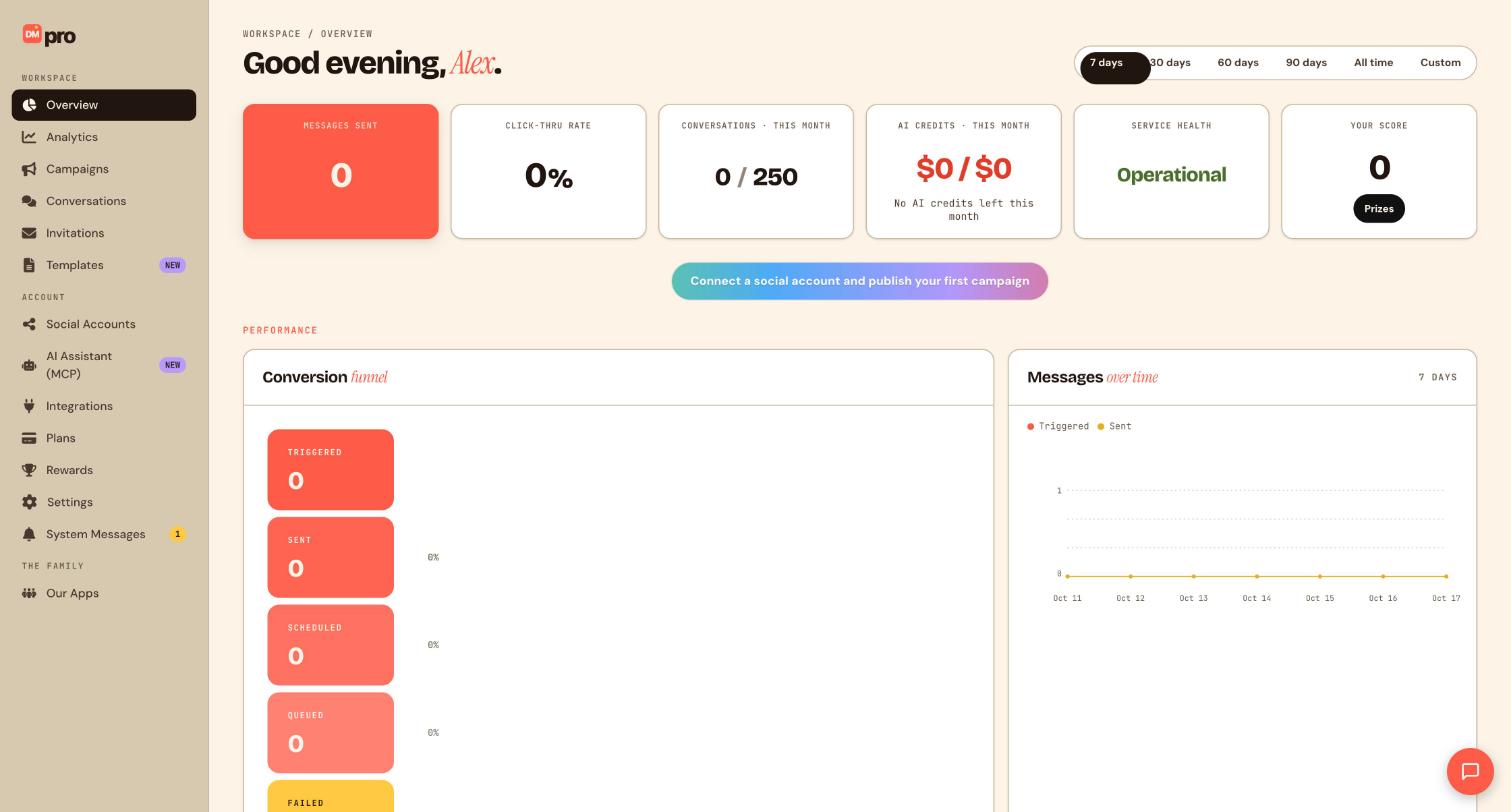
Live activity feed, usage meters, performance charts, quick actions, and service health indicators.
Everything in DMpro lives behind the sidebar. Here’s what each area is for:
| Area | What you do here |
|---|---|
| Dashboard | See automation stats, your live activity feed, and account health at a glance |
| Campaigns | Create, edit, pause, archive, and monitor your automations |
| Campaign builder | The visual flow editor where you drag triggers, rules, conditions, and actions onto a canvas |
| Templates | Start from a pre-built flow or save your own as a reusable template |
| Integrations | Connect or disconnect social accounts and e-commerce stores |
| Conversations | Your inbox of fan threads, with manual replies, batch send, and realtime updates |
| Catalogs | Upload product spreadsheets or use your synced store catalog |
| Store revenue | View sales analytics from your connected stores and affiliate networks |
| Message templates | Save reusable message snippets for your outbound conversations |
| Team | Invite workspace members and manage seats |
| Rewards | Earn referral scores and redeem prizes |
| Billing | Manage your subscription, overage settings, and gift codes |
| Settings | Your profile, two-step verification, notification preferences, and connected accounts |
—
Route: /dashboard, sidebar item Overview.
View live activity
- Click Overview in the sidebar.
- The Live activity panel streams recent automation events: comment triggers, DMs sent, webhook calls, AI responses.
- Each row shows platform icon, fan handle, campaign name, and timestamp.
- Click a row to jump to Conversations (
/conversations) filtered to that thread.
Monitor usage meters
- On Overview, locate the Usage this month card.
- Conversations meter shows count toward your plan limit (Free: 250/month).
- AI credits meter shows remaining monthly AI budget (Free: $3/month).
- When usage exceeds 80%, an amber banner appears with Upgrade on Plans linking to
/plans. - Free plan overage conversations bill at $0.08/conversation after the 250 cap.
Read performance charts
- Scroll to Campaign performance charts on Overview.
- Messages sent line chart, daily outbound volume across all platforms.
- Affiliate clicks bar chart, tracked
{{affiliate_link}}performance. - Top campaigns table, active campaigns ranked by conversations and click-through.
- Use the date-range picker (7d / 30d / 90d) to adjust chart windows.
Quick actions from Overview
- Click + New campaign in the header to open the platform picker.
- Click View all campaigns to navigate to
/campaigns. - Click Service health badge, green means webhooks are receiving; amber/red links to Help articles for troubleshooting.
Service health indicators
- Instagram/Meta webhooks: green when subscribed and receiving test events.
- TikTok webhooks: green when Business Messaging API is active.
- LinkedIn webhooks: green when Community Management subscription is verified.
- Telegram: green when bot token is valid and
/getWebhookInforeturns OK.
—
Still stuck? We’re happy to help.
Create your DMpro account, see pricing, or reach out to support directly.